Usually users dont care about their Internet traffic usage, especially on broadband lines as ISP’s provide unmetered bandwidth.
Unfortunately it is not the case for everyone, I have to pay for every single gigabyte of traffic that I use to my ISP. Can you believe that !?
Recently I noticed my ISP usage statistics are a tad high, so I decided to log my usage myself and compare it to my ISP stats.
I have a Mikrotik router which is somewhat advanced, so I expected an easy straight forward solution to measure my daily traffic, but to my surprise I was wrong.
Most solutions available are inaccurate -like query speed of interface every 5 minutes and calculate an estimate- or hard to implement and overkill.
So I came up with a novel idea. Here is the principle:
Most routers keep inbound & outbound bandwidth counters of their network interfaces. If we can query these numbers through SNMP on predefined intervals, we can calculate interface traffic precisely.
I am not going to tell you exactly how to do this, because it can be different for different routers, but principles are same:
First enable SNMP on your router. We need a read only community secret to query the interface stats. do it based on your router manual.
Now we need to find the exact OID of the counter that we want to query. Fortunately we can do it easily using Linux, I used my rasberrypi for this.
Simply run the following command :
snmpwalk -v2c -c SECRET_NAME -O e ROUTER_IP
Replace SECRET_NAME & ROUTER_IP accordingly.
It will query all of available OIDs on your router and you will get a long list of all kind of stats.
Here is what I got:
root@raspberrypi:~ # snmpwalk -v2c -c XXXX -O e 192.168.X.X
...
iso.3.6.1.2.1.2.2.1.2.7 = STRING: "pppoe-out1"
...
Nice ! I found the OID of the name of the interface that I want to track ! now I am interested in any OID ending in “.7” which is the index of interface.
Here is how you can cheat now, go into web interface of your router and read the counter and try to find it in the snmpwalk output:
iso.3.6.1.2.1.31.1.1.1.6.7 = Counter64: 10691336085
Cool! now we have the OID which we need: “iso.3.6.1.2.1.31.1.1.1.6.7” (pay attention it ends in “.7”)
Now we can query this OID whenever we want and record it. In my case it shows the inbound traffic on interface “pppoe-out1”.
Use snmpget command to query the OID:
snmpget -v2c -c SECRET_NAME -O q ROUTER_IP OID
The easiest way to set this up is to set a cronjob to query the interface on regular intervals. As I am only interested in Daily traffic usage, I set it to run once daily. You can set it to run every hour or even every minute. As I am a simple soul, I use a simple text file to record my logs, but it is possible to record the data in all kind of formats or even write it into a DB engine. it depends on how you want to process your data. Here is my cronjob :
0 0 * * * echo `date \+\%F`| tr '\n' ',' >> /var/log/dl-bw.log;snmpget -v2c -c XXXXX -O q 192.168.X.X iso.3.6.1.2.1.31.1.1.1.6.7 | cut -d ' ' -f2 >> /var/log/dl-bw.log
It queries the interface every night on 12:00 AM and appends the data to /var/log/dl-bw.log
If you subtract today’s value from yesterday’s, you would get today’s usage 😉
I am not suggesting to do it manually! You should write a program to process these data and present it to you as you wish.
But you got the idea now. Good luck 😀
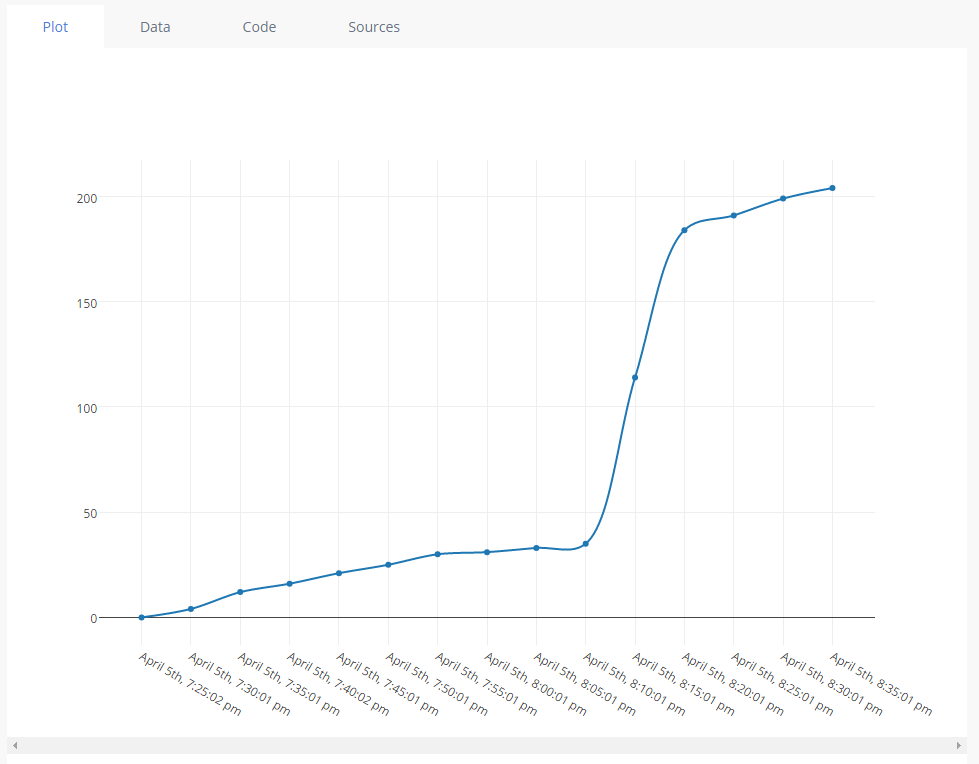
EDIT : Well, actually writing this long post motivated me to make my bandwidth monitoring more fun! so I changed the monitoring interval to 5 minutes and wrote a little NodeJS program to process the data and upload the data to plot.ly so I can have a nice chart 😀
Here is my new cronjob
*/5 * * * * echo `date \+\%s`| tr '\n' ',' >> /var/log/dl-bw.log;snmpget -v2c -c XXXXX -O q 192.168.X.X iso.3.6.1.2.1.31.1.1.1.6.7 | cut -d ' ' -f2 >> /var/log/dl-bw.log
And my little NodeJS program to process the data, I have removed the private data from the code :
const fs = require('fs');
const plotly = require('plotly')('XXXX', 'XXXXX'); // plotly API keys
const lineReader = require('readline');
const moment = require('moment-timezone');

var lr = lineReader.createInterface({
    input: fs.createReadStream('/var/log/dl-bw.log')
});

var ref = 0;
var yarr = [],
    xarr = [];

lr.on('line', function(line) {
    s = line.split(',');
    if (ref == 0) {
        ref = s[1];
        xarr.push(moment(s[0], 'X').tz("America/Los_Angeles").format('MMMM Do, h:mm:ss a'));
        yarr.push(0);
    } else {
        xarr.push(moment(s[0], 'X').tz("America/Los_Angeles").format('MMMM Do, h:mm:ss a'));
        yarr.push(Math.round((s[1] - ref) / 1048576)); // convert to MB
    }
});

lr.on('close', () => {
    var data1 = {
        "name": "BW USAGE",
        "x": xarr,
        "y": yarr,
        "line": {
            "dash": "solid",
            "shape": "spline"
        },
        "type": "scatter"
    };

    var data = [data1];
    var graphOptions = {
        filename: 'BW_Graph',
        fileopt: "overwrite"
    };

    plotly.plot(data, graphOptions, function(err, msg) {
        console.log(msg.url);
    });

});
And it is the result: